Graph 3 RSN change in gov funding per head between 2025-26 and 2028-29
← Shropshire funding per person set to fall to 29% less than national average
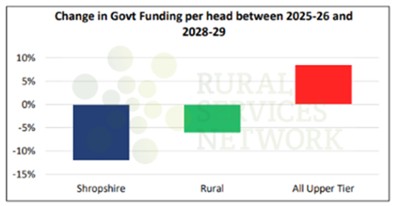
A graph showing the change in government funding per head between 2025-26 and 2028-29 as part of an analysis by the Rural Services Network.
A graph showing the change in government funding per head between 2025-26 and 2028-29 as part of an analysis by the Rural Services Network.